※ 해당 설치는 Storage 연동을 따로 할당하지 않았기 때문에 VM이 재기동 될때, 기존 저장된 로그 데이터는 사라집니다.
[1] Github(k8s-1pro)에서 Prometheus(with Grafana), Loki-Stack yaml 다운로드
▶ [k8s-master] Console 접속 후 아래 명령 실행
[root@k8s-master ~]# yum -y install git

# 로컬 저장소 생성
git init monitoring
git config --global init.defaultBranch main
cd monitoring

# remote 추가 ([root@k8s-master monitoring]#)
git remote add -f origin https://github.com/k8s-1pro/install.git

# sparse checkout 설정
git config core.sparseCheckout true
echo "ground/k8s-1.27/prometheus-2.44.0" >> .git/info/sparse-checkout
echo "ground/k8s-1.27/loki-stack-2.6.1" >> .git/info/sparse-checkout

# 다운로드
git pull origin main
[2] Prometheus(with Grafana) 설치
# 설치 ([root@k8s-master monitoring]#)
kubectl apply --server-side -f ground/k8s-1.27/prometheus-2.44.0/manifests/setup
kubectl wait --for condition=Established --all CustomResourceDefinition --namespace=monitoring
kubectl apply -f ground/k8s-1.27/prometheus-2.44.0/manifests

# 설치 확인 ([root@k8s-master]#)
kubectl get pods -n monitoring
▶ 확인 결과

[3] Loki-Stack 설치
# 설치 ([root@k8s-master monitoring]#)
kubectl apply -f ground/k8s-1.27/loki-stack-2.6.1

# 설치 확인
kubectl get pods -n loki-stack
▶ 확인 결과

[4] Grafana 접속
▶ 접속 URL : http://192.168.56.30:30001
▶ 로그인 : id: admin, pw: admin
▶ 확인 결과

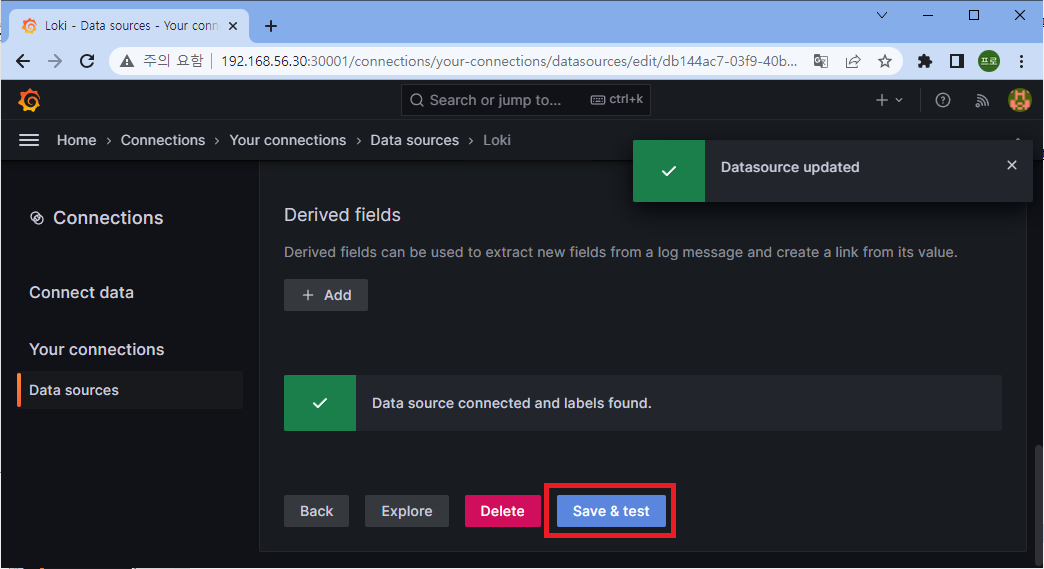
[5] Grafana에서 Loki-Stack 연결
▶ Connect data : Home > Connections > Connect data
▶ 검색에 [loki] 입력 후 항목 클릭

▶ URL에 내용 입력 : http://loki-stack.loki-stack:3100

▶ 하단 Save & Test
※ 설치를 삭제해야 할 경우, 아래 명령을 이용하면 됩니다.
- Prometheus(with Grafana), Loki-stack 삭제
▶ [k8s-master] Console 접속 후 아래 명령 실행
[root@k8s-master ~]# cd monitoring

# Prometheus 삭제
kubectl delete --ignore-not-found=true -f ground/k8s-1.27/prometheus-2.44.0/manifests -f ground/k8s-1.27/prometheus-2.44.0/manifests/setup

# Loki-stack 삭제
kubectl delete -f ground/k8s-1.27/loki-stack-2.6.1'Kubernetes > Study' 카테고리의 다른 글
| [K8s-1pro] install (1) | 2025.06.18 |
|---|---|
| [K8s] 쿠버네티스 표준 생태계 오픈소스 (0) | 2025.06.17 |
| 3. Object 그려보며 이해하기 (0) | 2025.04.21 |
| 1. 쿠버네티스 쉽고 빠르게 설치하는 방법 - Mac 버전용 (m시리즈) (0) | 2025.04.18 |
| 0. install for mac (0) | 2025.04.18 |


